Stock Overview
You need to scroll following tables to see the whole data.
* Please scroll/swipe tables horizontally to see remaining data.
Shares and Shareholders
As of September 30, 2023
| Authorized | Issued | Shareholders |
|---|---|---|
| 5,321,974,000 shares | 1,566,614,098 shares | 16,871 |
Principal Shareholders
As of September 30, 2023
| Name | Number of shares held | % of total shares in issue |
|---|---|---|
| Mitsubishi UFJ Financial Group, Inc. | 588,723,490 shares | 37.57% |
| Maruito Shokusan Co., Ltd. | 273,467,550 shares | 17.45% |
| Maruito Co., Ltd. | 125,533,430 shares | 8.01% |
| The Master Trust Bank of Japan ,Ltd. (Trust Account) |
99,161,400 shares | 6.32% |
| Foundation of Kinoshita Memorial Enterprise | 92,192,320 shares | 5.88% |
| Maruito Shoten Co., Ltd. |
38,733,200 shares | 2.47% |
| Mitsubishi UFJ Trust and Banking Corporation |
31,572,800 shares | 2.01% |
| Custody Bank of Japan, Ltd. (Trust Account 4) | 27,342,800 shares | 1.74% |
| Custody Bank of Japan, Ltd. (Trust Account) | 14,897,000 shares | 0.95% |
| ALOA SHOKUSAN G.K. | 14,000,000 shares | 0.89% |
The Ownership and Distribution of Our Shares by Category of Shareholders
As of September 30, 2023
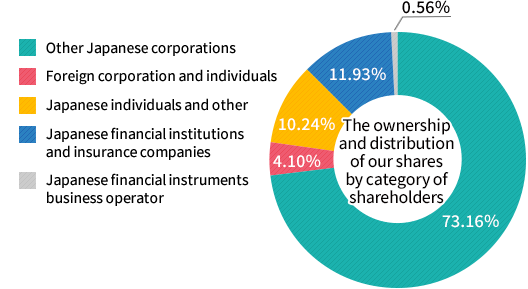
| Japanese financial institutions and insurance companies (%) | Japanese financial instruments business operator (%) | Other Japanese corporations (%) | Foreign corporation and individuals (%) | Japanese individuals and other (%) | |
|---|---|---|---|---|---|
| September 2023 | 12.16 | 0.74 | 73.14 | 3.60 | 10.36 |
| March 2023 | 12.22 | 0.71 | 73.18 | 3.61 | 10.28 |
| March 2022 | 13.03 | 0.53 | 72.94 | 3.32 | 10.18 |
| March 2021 | 12.31 | 0.21 | 70.26 | 4.87 | 12.35 |
| March 2020 | 8.98 | 0.17 | 74.97 | 4.75 | 11.13 |
Breakdown by Number of Shares Held
As of September 30, 2023
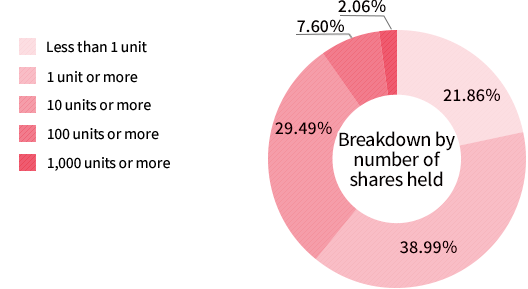
| Number of shareholders | Ratio (%) | |
| Less than 1 unit | 3,666 | 21.73 |
| 1 unit or more | 7,927 | 46.98 |
| 10 units or more | 4,161 | 24.67 |
| 100 units or more | 909 | 5.39 |
| 1000 units or more | 208 | 1.23 |
| total | 16,871 | 100.00 |
Breakdown by Registered Location
As of September 30, 2023
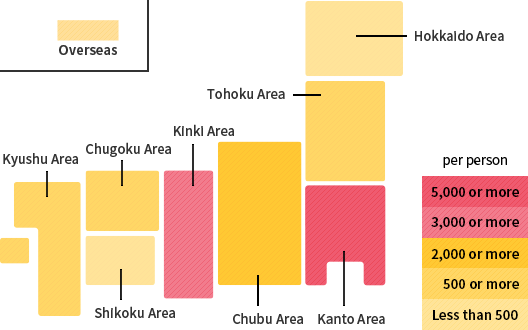
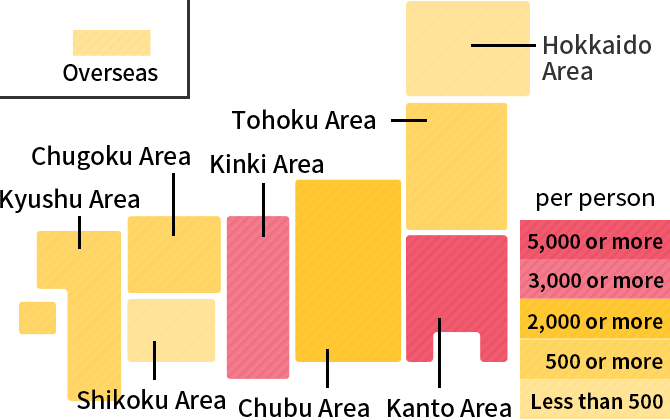
| Number of shareholders | Ratio (%) | |
| Hokkaido Area | 347 | 2.06 |
| Tohoku Area | 627 | 3.72 |
| Kanto Area | 7,107 | 42.13 |
| Chubu Area | 2,691 | 15.95 |
| Kinki Area | 3,548 | 21.03 |
| Chugoku Area | 756 | 4.48 |
| Shikoku Area | 440 | 2.61 |
| Kyushu Area | 1,140 | 6.76 |
| Overseas | 215 | 1.27 |
| total | 16,871 | 100.00 |